Cyber Risk Forecast for Hospitals and Health Systems
$75 / Month Subscription
Get your Business-level risk forecast
for the price of a daily latte.
And the first month's forecast is free. Cancel at any time.
Name
Company Name
We will not send spam
You'll be taken to the payment screen after subscribing here.
Hospitals & Health Sytems
Cyber Risk Forecast

Monthly Cyber Risk Forecast
Cancel at any time.
Understand how ransomware, system disruption, and patient data exposure translate into operational and financial impact— and how likely your organization is to be impacted
Hospitals and health systems face a threat landscape where cyber incidents directly affect patient care. Ransomware and system outages do not simply disrupt IT—they delay procedures, divert patients, and impact clinical decision-making.
The healthcare sector is a high-value target due to the volume and sensitivity of patient data, as well as the reliance on interconnected systems across care delivery. Attacks are increasing in frequency and often exploit dependencies between systems such as billing, imaging, and electronic health records.
This forecast focuses on how these attack patterns are evolving across the sector. It establishes an industry baseline model and then customizes that based on three critical factors that determine the individual business risk: exposure, how attractive the data is, and maturity of security practices.
Answer 3 questions, and as soon as you select your profile you have cyber risk quantified for your business.
Your Business-Level Risk Forecast
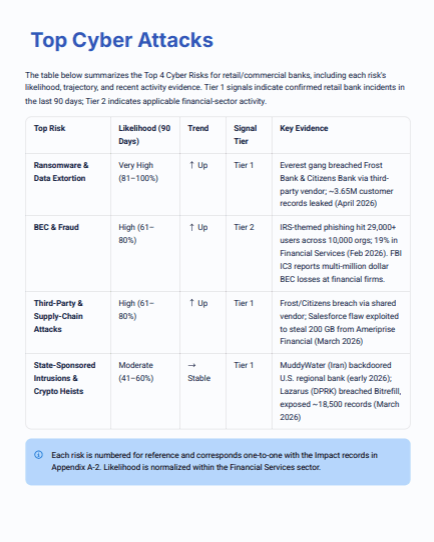
Overview of the top risks
Priority actions for CISOs on strategy and mitigations for the next 90 days
Estimated (typical) financial impact for each risk category
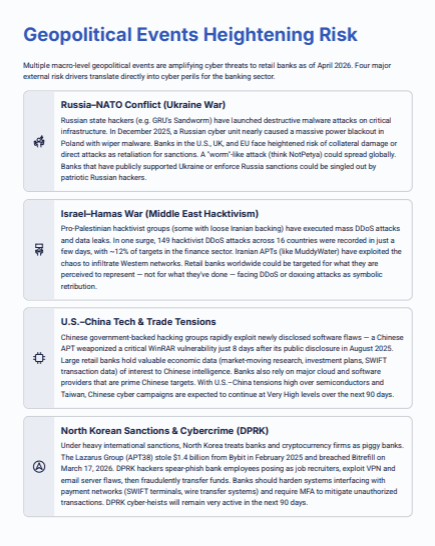
Overview of geopolitical events driving risk and how it impacts your industry
A 30-60-90 day outlook of how attacks are anticipated to shift
Your industry risk quantified: each attach scenario likelihood and corresponding financial impact estimate (industry 'typical' profile)
Your business-level risk quantified: customized profiles that quantify your organization's risk based on the three primary characteristics that determine your likelihood of being targeted for attack, the success factor, and reasonably expected financial impact.
Control maturity matrix so you see how you compare to the industry baseline
For leadership, the challenge is balancing regulatory compliance with actual resilience. This forecast provides visibility into which risks are most likely to disrupt care delivery and which controls have demonstrated impact in reducing those outcomes.
The Game Changer

Built for Your Business
This forecast is built specifically for your business, using observed attack patterns and financial impact models relevant to organizations like yours.

Timely
Each forecast reflects the most recent 30–90 days of observed cyber activity and is recalculated monthly.

Customized
The forecast adjusts based on exposure, attractiveness, and security maturity, allowing leadership to understand their specific risk position.

Decision Support
Executives use the forecast to make time-bound decisions based on quantified exposure.
A Peek Inside a Sample Report
Summary
You'll get an overview of the top risks in your industry, as well as an overview of what's happening in your industry.
This is your go-to for a quick snap-shot of where things stand.
When leadership asks "What's our top risk"? you'll get your answer right here.
Industry signals made relevant to your business.
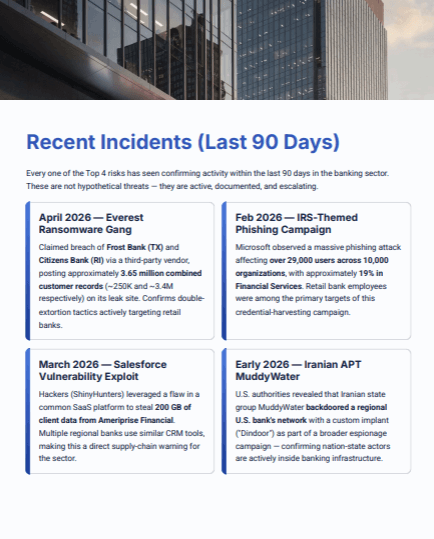
Review of recent events
Every report is grounded in recent events (30-60-90 days). This section gives you a recap of the hundreds of sources and incidents reviewed in that time period. These are the most impactful events, the ones that are shaping what the future expectation will be.
When leadership asks "What changed recently?", this is what you can reference because these are the events driving risk.
Deep insights into what is shaping your risk.
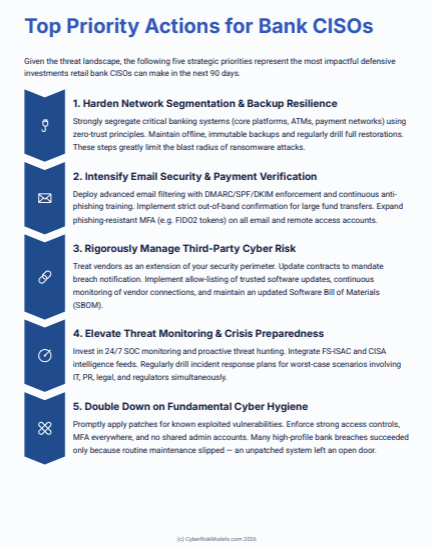
Priority Actions
This is where you'll get actionable recommendations for strategy and mitigation. These are based on an analysis of what actually reduces risk, business impact, and blast radius.
So when you get asked "What can we do?", you've got the answer right here. This will drive your conversations around prioritization with limited resources.
Actionable recommendations.
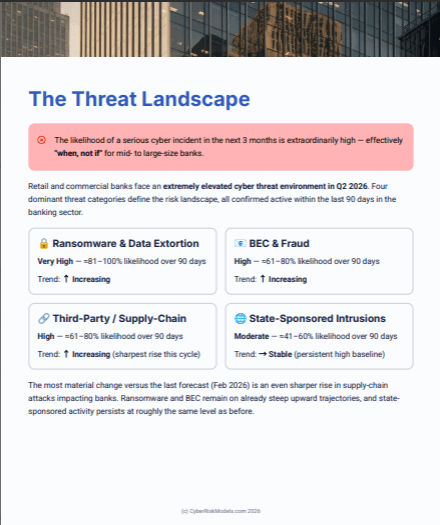
Top Attacks Trending
Every report will give you the top attacks, the likelihood they will occur in the industry based on how they trended in the past 30-60-90 days.
When leadership asks "What should we expect next?", this is where you come for the deep insight as to whether a risk is increasing, decreasing or holding steady.
Insights into attack patterns.
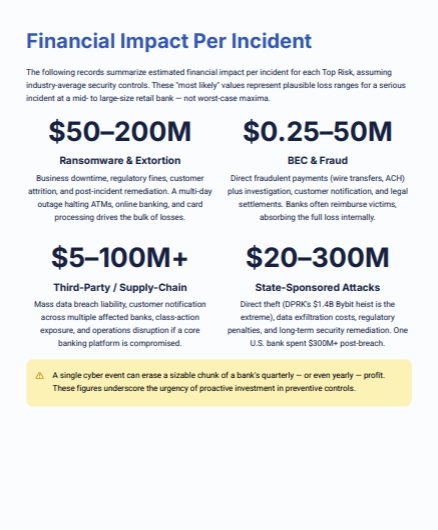
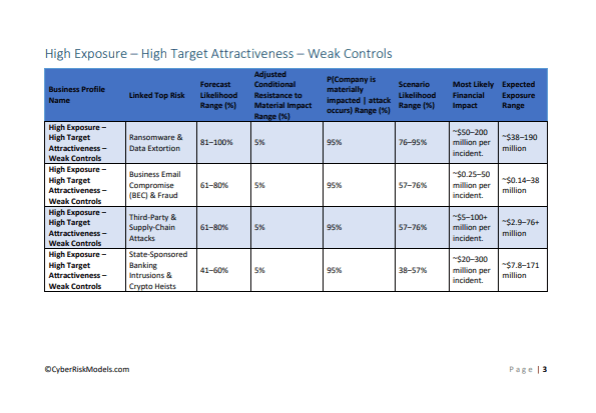
Financial Impact
We quantify the impact in financial terms, based on what's been reported actually happening in your industry, in the last 30-60-90 days. These are real organizations, not that different from yours, and the real cost.
So, when leadership asks "What are the typical costs?" you'll have real numbers to share with them. But we know every business is unique, that's why we give you business profiles that dial these number in for your organization, based on your exposure, how attractive your data is, and the maturity of your security.
Solid numbers based on real data.
Geopolitical Events
In today's world, geopolitical events are shaping risk across all industries. We give you the highlights, those events that impact your industry, and could impact your organization.
So, when leadership asks "What should we be aware of?" you'll sound like the smartest person in the room because you'll have deep insights into the most likely impact of geopolitical event for your organization (not just the industry).
Understanding beyond the headlines.
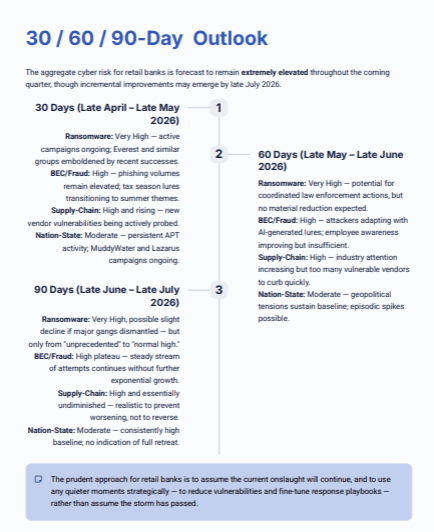
The 30-60-90 Day Outlook
Based on recent events we forecast the most likely categories of attacks over the next 30-60-90 days. When you are discussing strategy, mitigations, or spending this is where you can refer to dial-in expectations.
So, when leadership asks "What should we expect this quarter?", you'll have a ready answer based on real events.
That's a pretty powerful position to be in.
Your Business Profile
There are three characteristics that determine which businesses are more likely to be targeted and attackers to be successful; exposure, how attractive your data is, and how mature your security practices are. We've quantified every combination and give them to you as business profiles. Your business fits one of them.
So when leadership asks "How does that relate to us?" you'll know the likelihood of each attack scenario and expected financial impact specific to your business.
Pick your profile and know you business-level risk.
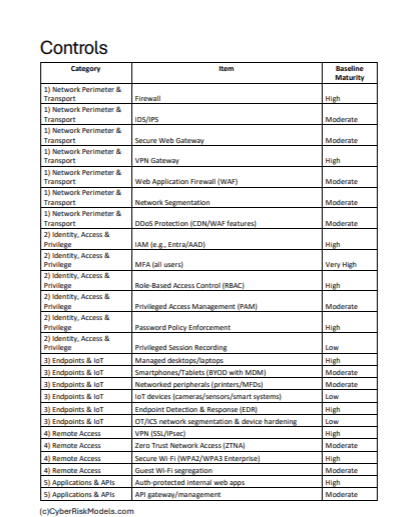
Controls
To help you evaluate your security we give you the industry baseline of controls and maturity level. This isn't an assessment, this is just a reference for you when you have discussions around security.
So, when Operations argues that your security is better than the industry average, you'll have the industry average available for comparison. And, when leadership asks "How are we doing?" you'll be able to discuss where you are better, or worse than your peer organizations.
Knowing how you compare the industry baseline is useful in highlighting areas for improvement that move you out of the "likely victim" group by reducing attacker success rates.

Get in touch
Charlene Deaver-Vazquez
Charlene@CyberRiskModels.com
(301) 346-3752
Have a question?
Let's talk about it.